Things move, which is enough for some people, but not for us Physicists! We like to know how they move and what distance is covered and how speed changes over time. Graphs are a great way of showing the motion of things as they contain all the information we need all together.
The simplest graph is a distance-time graph, plotting distance on the y-axis and time on the x-axis. The shape of the graph will tell us at a glance how the thing, say a car, is moving. We can also work out the speed of the car from the gradient, which is the slope of the line.
We calculate the gradient as y/x, which in this case means that we follow the equation speed = distance/time. So here we can see that the gradient in (a) is smaller than that in (b), which means that car A is going slower than car B. We also know this intuitively because car B has travelled further than car A in the same amount of time. Car C is very lazy and the gradient is zero, which means that it is stationary. The most interesting case is car D which has a changing gradient. You can work out the speed at any point by finding the gradient at that point, but move a little along the line and you’ll have to re-do the calculation. This means the car is accelerating (in this case, or it could also be decelerating if the gradients were getting smaller).
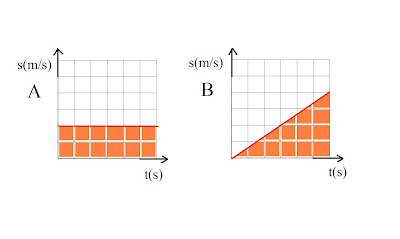
It’s easier to see the acceleration on a speed-time graph. You can either get your speed-time graph by plotting the gradient at each point of your distance-time graph, or you can measure the data separately as part of the experiment.
So this time if we measure the gradient we get acceleration because the same calculation y/x this time corresponds to acceleration = speed/time. We can easily see here that car A is travelling at a steady speed, and car B has steady acceleration. But there is another use for this graph as well, which is why I prefer it to the distance-time graph. The area under the graph (the shaded area) is equal to speed x time which is distance, so you can also tell how far your car has gone, all from one graph.
Just a small aside to end, you may also see velocity-time graphs. Velocity and speed are often used to mean the same, and when the motion is in a straight line, then they are the same. But velocity is also to do with the direction of travel. Imagine a toy train going around a circular track, the speed stays the same the whole time, but because the direction of the train is always changing, then the velocity is changing too. A little complicated I know, but it’s worth remembering if you want to be precise in your use of the words “speed” and “velocity”.


No comments:
Post a Comment